of modules showed reportable thermal abnormalities
 Request an inspection
KAJH Aerial · Solar PV thermal inspection
Cleaning
Verification
Inspection overview
What looked like dirt
was also a thermal problem.
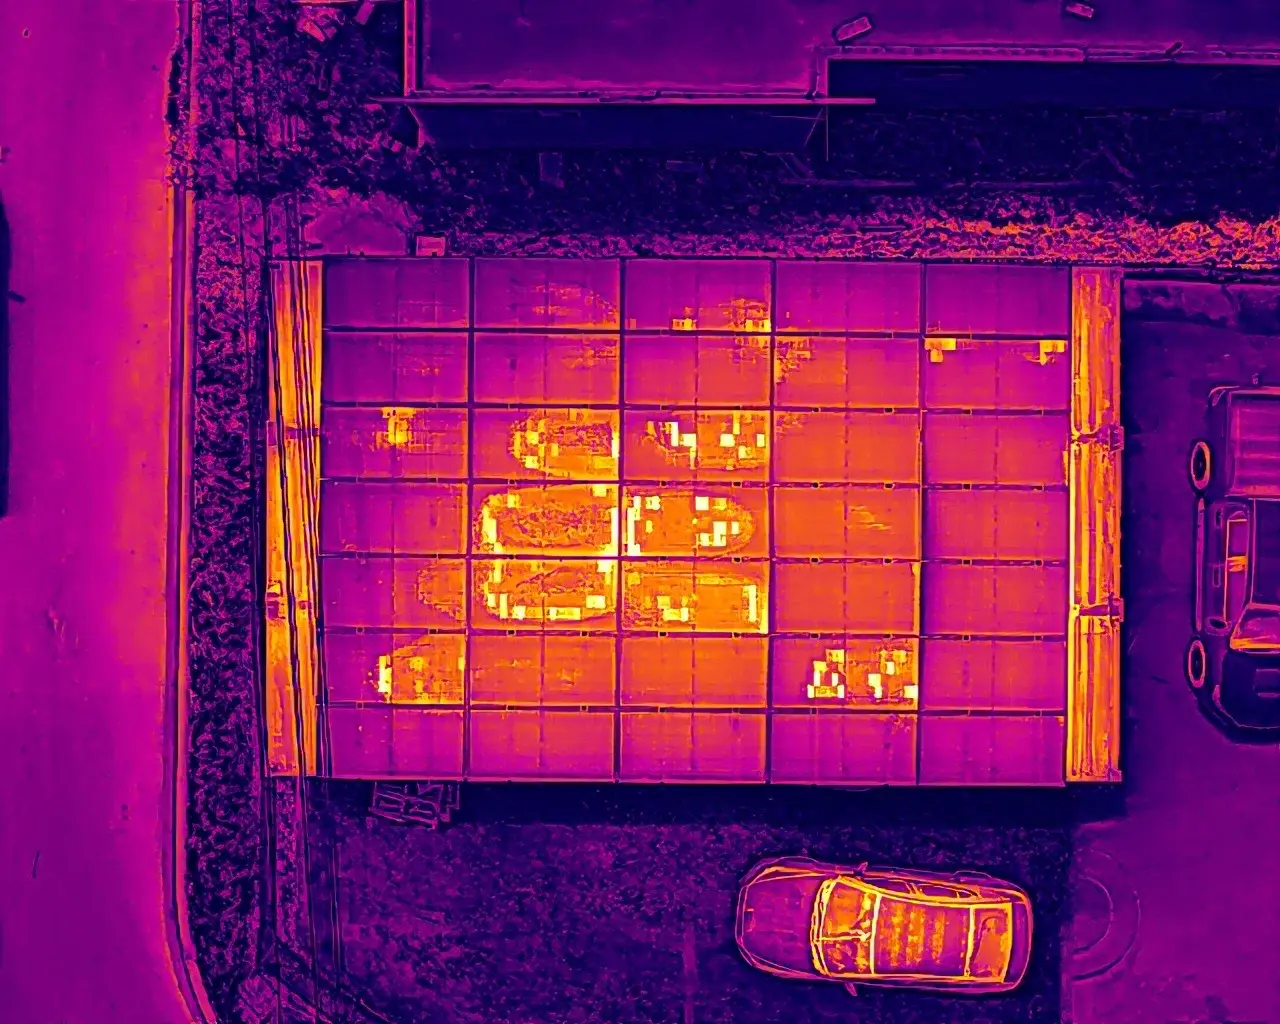
An initial RGB and radiometric thermal inspection found reportable abnormalities across nearly one-third of this 35-module solar PV array.
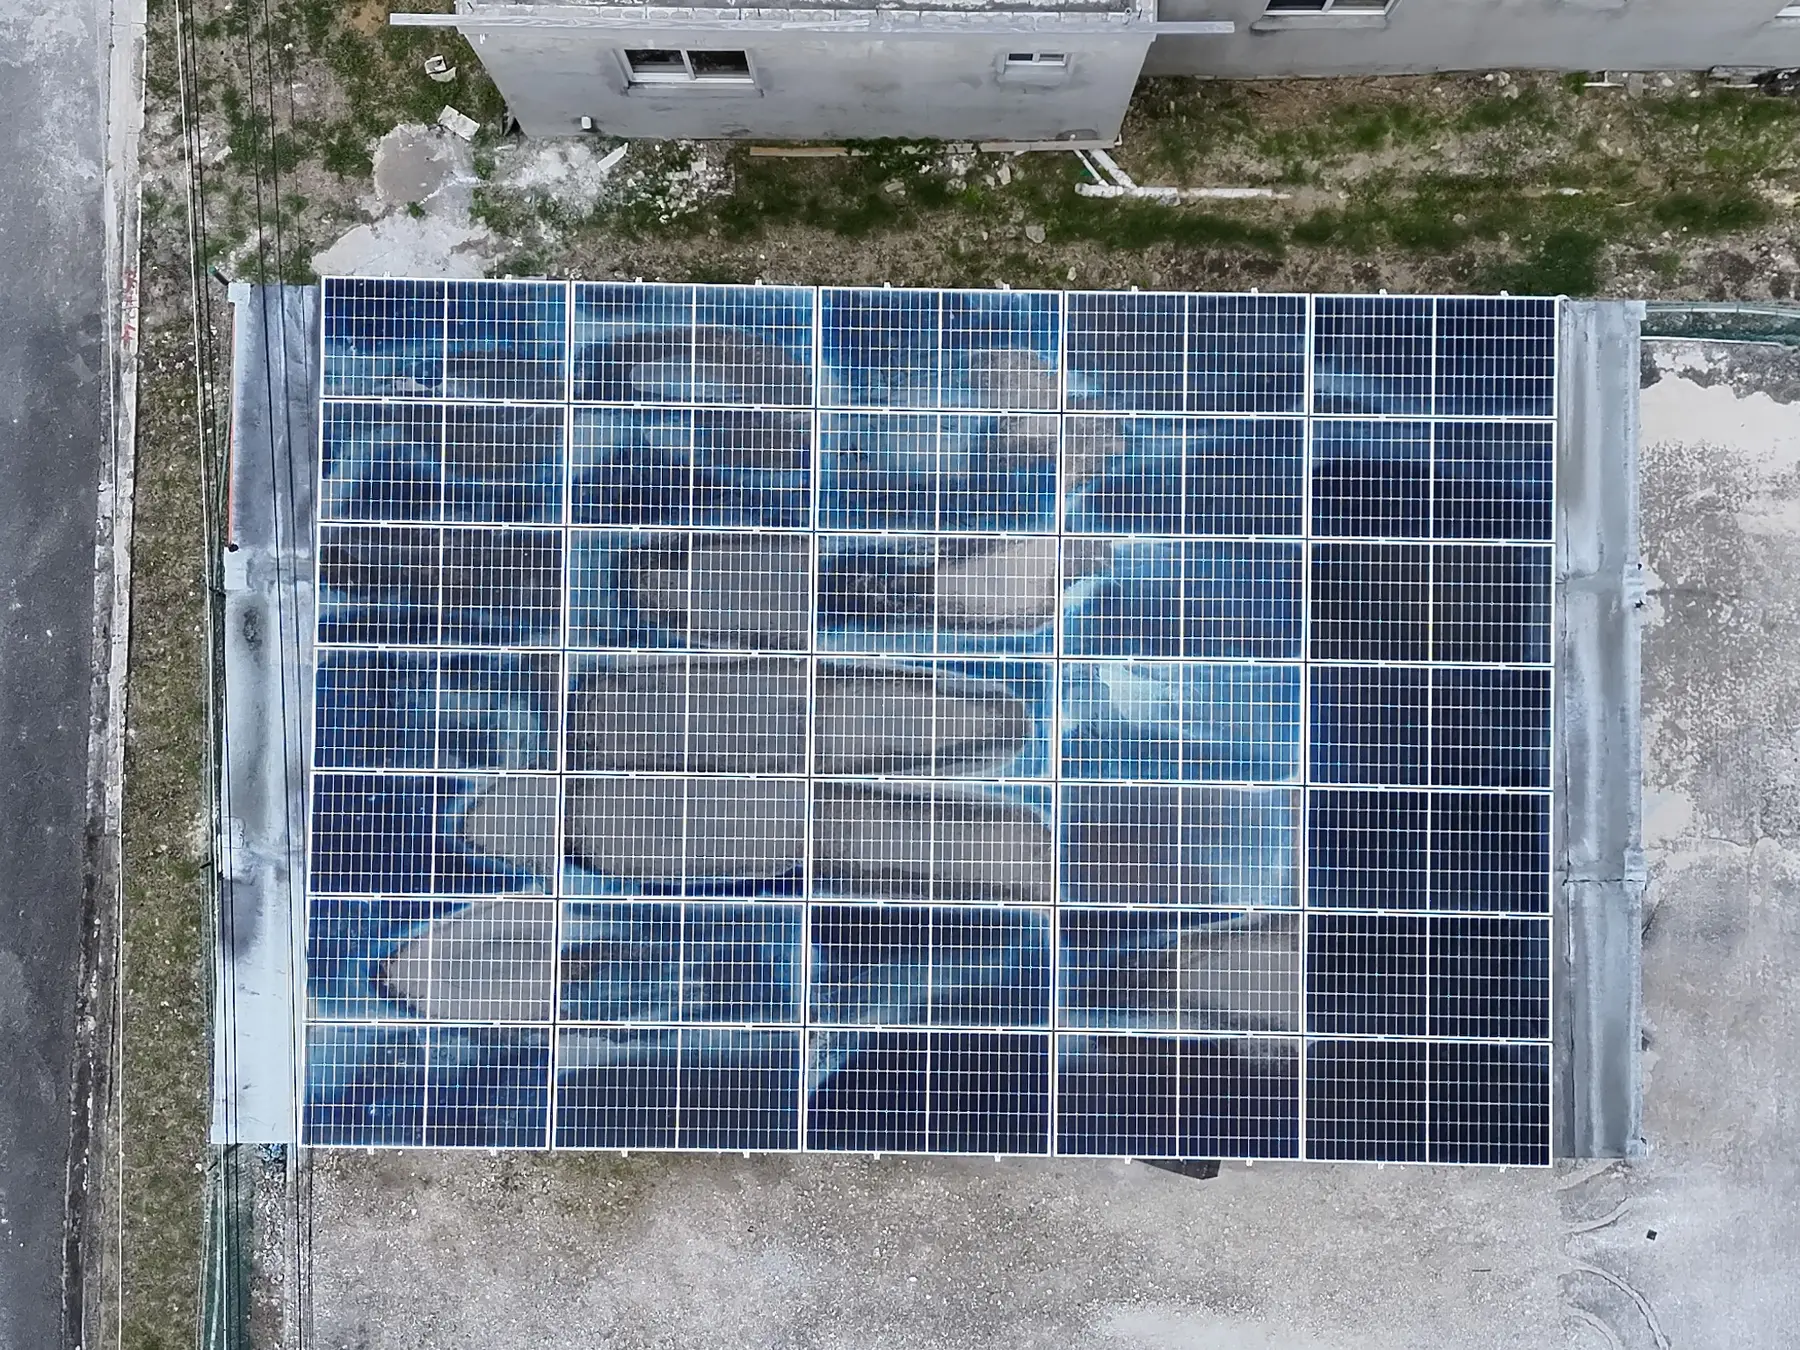
Eleven modules showed significant abnormal heating, including eight with widespread elevated temperatures. Several affected areas aligned with heavy surface soiling visible in the RGB imagery, demonstrating why visual inspection alone could not fully describe the operating condition.
- System type
- Roof-mounted solar PV
- Array size
- 35 modules
- Initial findings
- 11 affected modules
- Follow-up
- Post-cleaning reinspection
Initial inspection
The array was operating,
but not uniformly.
modules exhibited widespread abnormal heating
highest recorded temperature in the affected area
maximum reported temperature differential
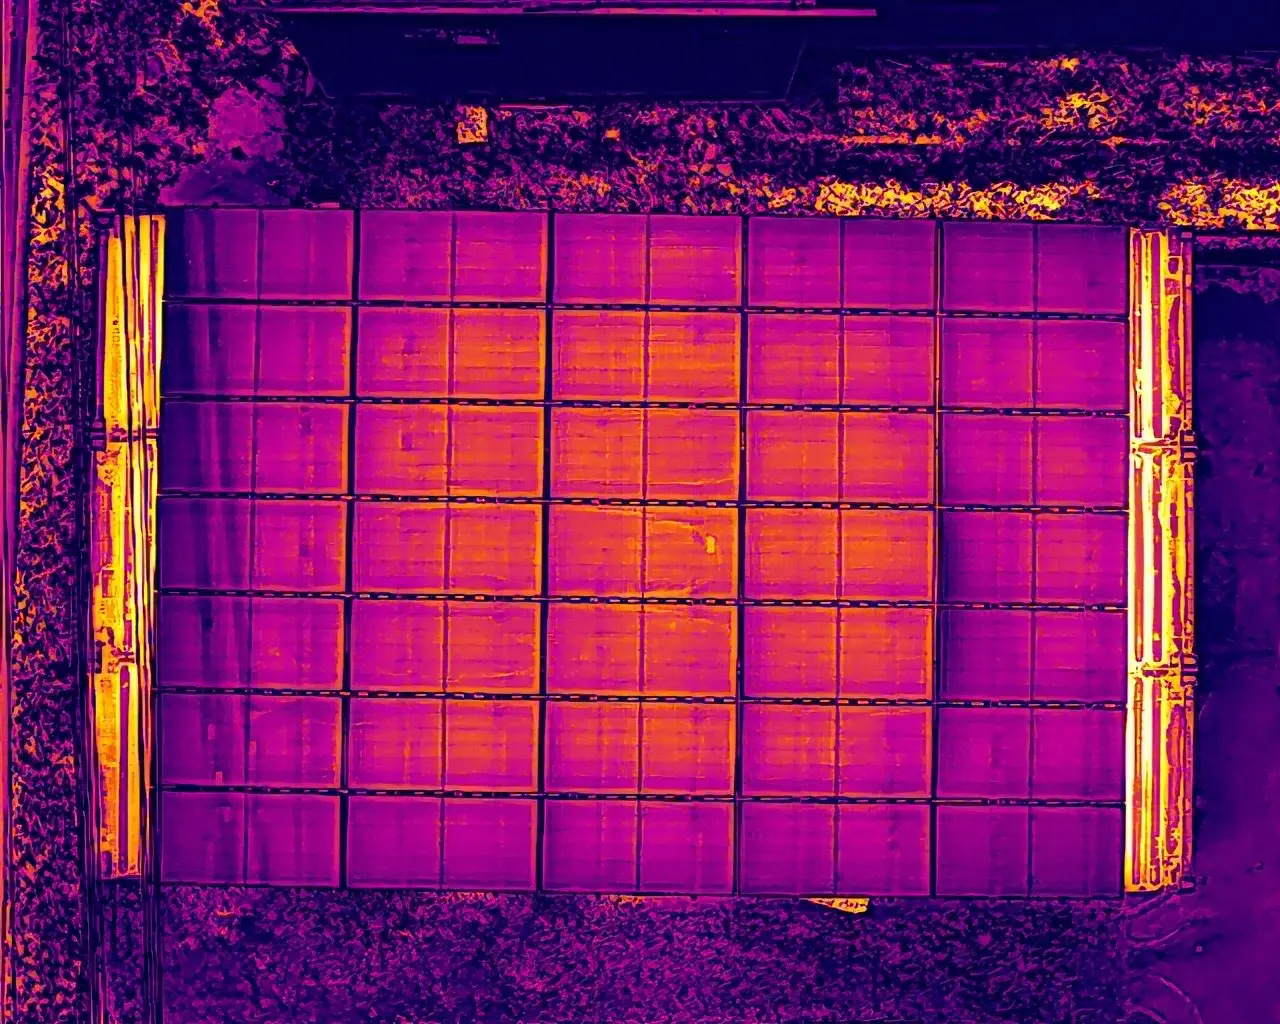
Affected areas reached 74.6°C while comparable modules were operating around 53–55°C under the recorded inspection conditions.
Understanding the findings
What does a thermal
difference actually mean?
Thermal delta, written as ΔT, is the temperature difference between an anomalous area and a comparable unaffected cell or module operating under similar conditions.
It is not a comparison with the surrounding air. A ΔT of 19.5°C means the affected area was operating approximately 19.5°C hotter than the suitable reference area. The result becomes meaningful when interpreted alongside the thermal pattern, affected component, operating state and recorded inspection conditions.
Affected area74.6°C
−Comparable modules53–55°C
=Reported thermal delta19.5°C
IEC + ANSI/NETA
One framework evaluates the PV abnormality. The other guides response urgency.
IEC TS 62446-3:2017 defines the PV-specific infrared inspection method and a pattern-based matrix for thermal abnormalities. ANSI/NETA MTS Table 100.18 provides comparative temperature-rise bands and recommended maintenance actions for similar electrical components under similar loading. Used together, they support both technically sound interpretation and a clear response priority.
NETA 01Possible deficiency
ΔT 1–3°CInvestigate the condition and confirm that the comparison, loading and inspection conditions are valid.
NETA 02Probable deficiency
ΔT 4–15°CFurther assessment and corrective maintenance are indicated. Repair should be planned as operating conditions permit.
NETA 03Major discrepancy
ΔT > 15°CImmediate repair is recommended. The specific response—cleaning, electrical testing, isolation or replacement assessment—depends on the observed condition.
IEC CoA evaluates the complete PV abnormality using the observed pattern, affected component, extent and safety relevance. The NETA response band separately establishes maintenance priority from the comparative temperature rise.
Operating condition considered acceptable. No imminent corrective action.
Investigate the cause and complete any necessary rectification within a reasonable period.
Prompt interruption where appropriate, followed by investigation and rectification.
Point, cell, substring, module-wide or extended-area heating.
Cell, module, bypass diode, junction box, connector or circuit path.
Temperature difference evaluated in relation to 1,000 W/m² where required.
Number of affected cells or modules and distribution across the array.
Evidence of damage, arcing risk, insulation loss or other hazardous conditions.
Irradiance, wind, load, viewing angle, reflections and operating state.
Anomaly classification: CoA 2 / NETA 03
The module-wide abnormal heating pattern was classified as CoA 2, requiring investigation and corrective action. The maximum measured ΔT of 19.5°C placed the finding in NETA 03, establishing immediate priority for cleaning followed by thermal reinspection.
Image evidence
RGB context.
Thermal behaviour.
Each stage pairs standard visual imagery with thermal imagery so visible surface conditions can be compared with the heat pattern across the same array.
Initial array overview
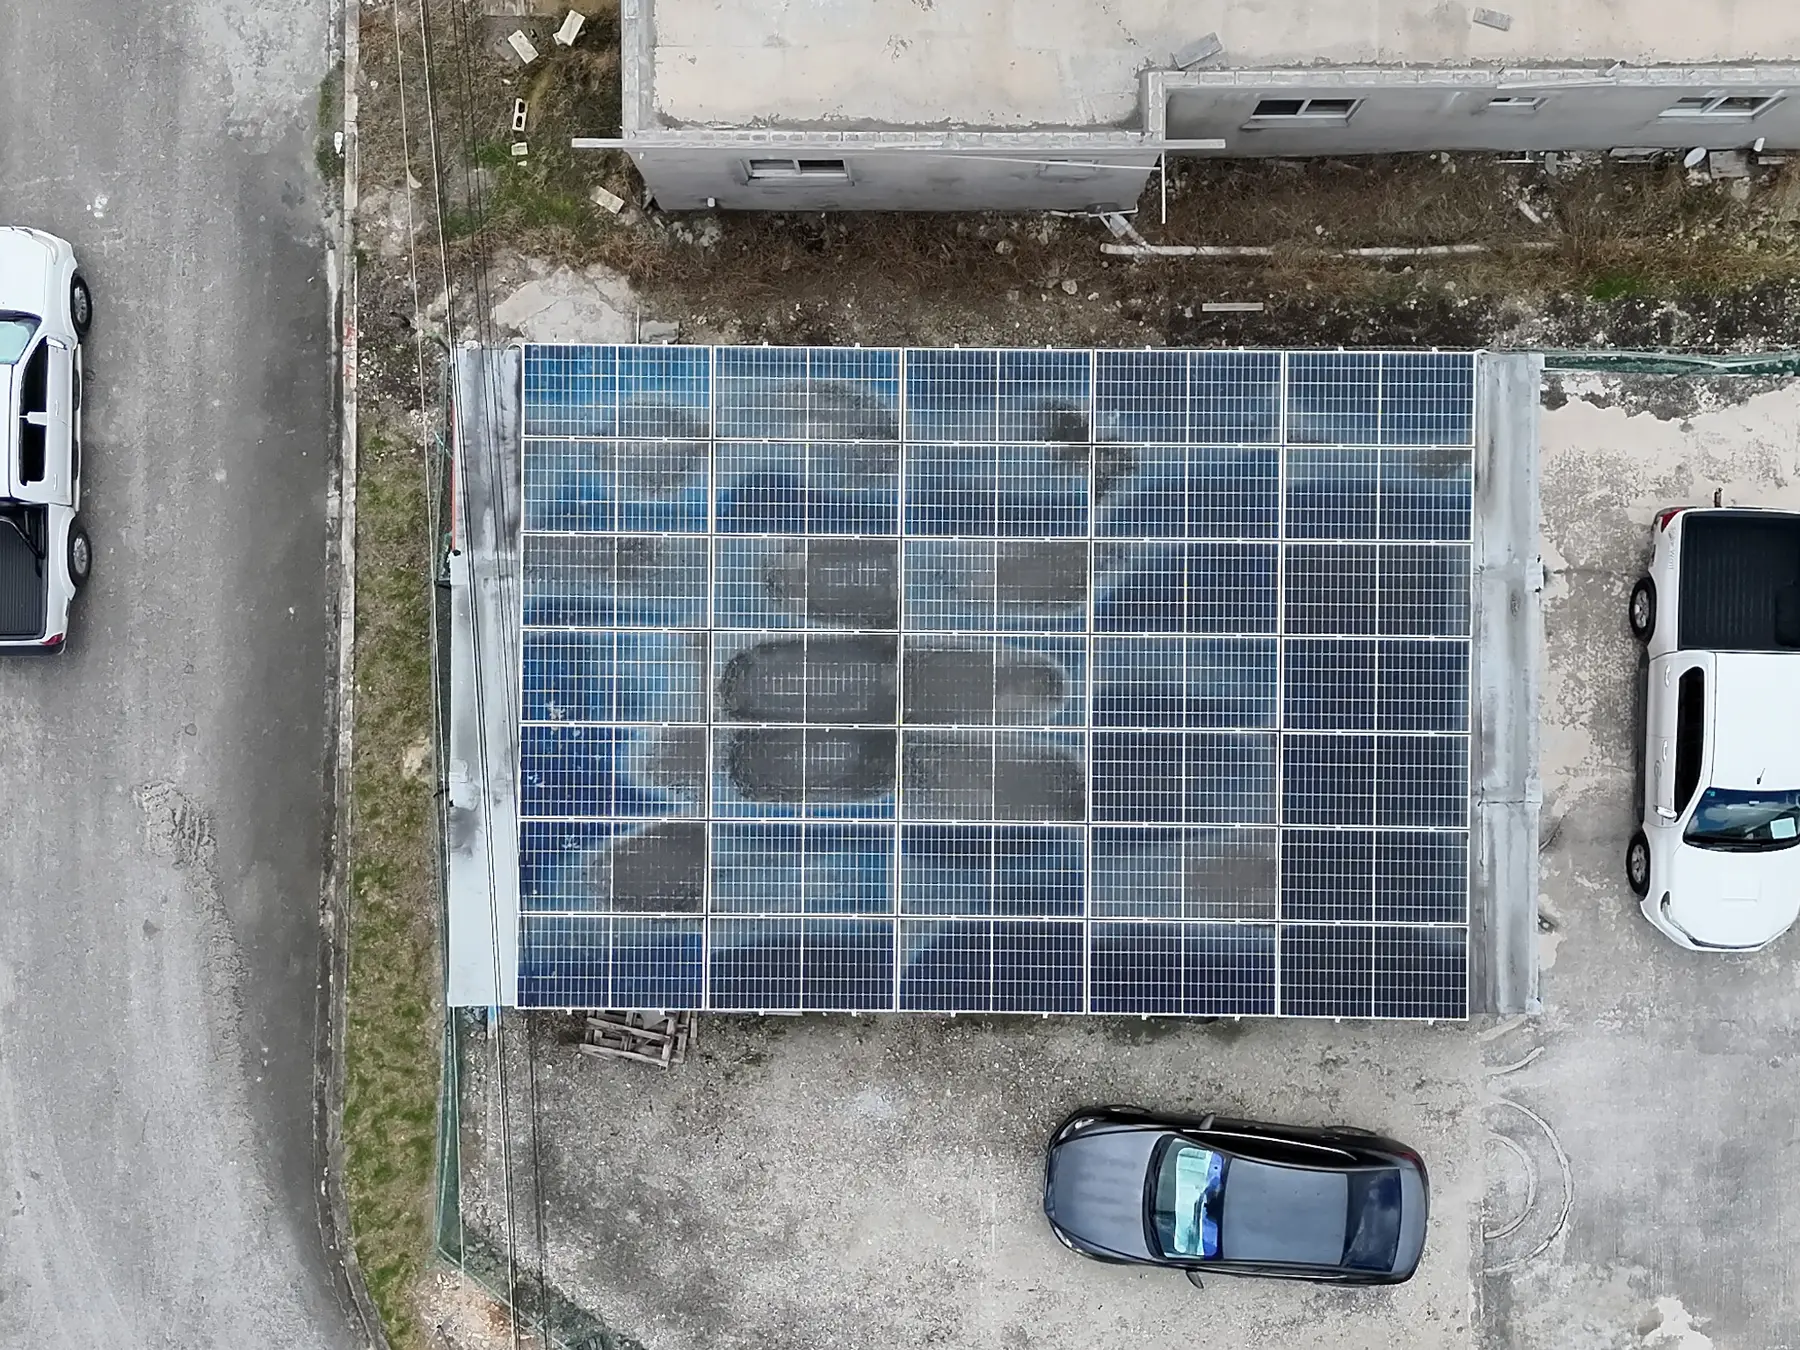
Heavy surface contamination was visible across several modules. The thermal overview showed widespread non-uniform heating across the same area.
Closer inspection
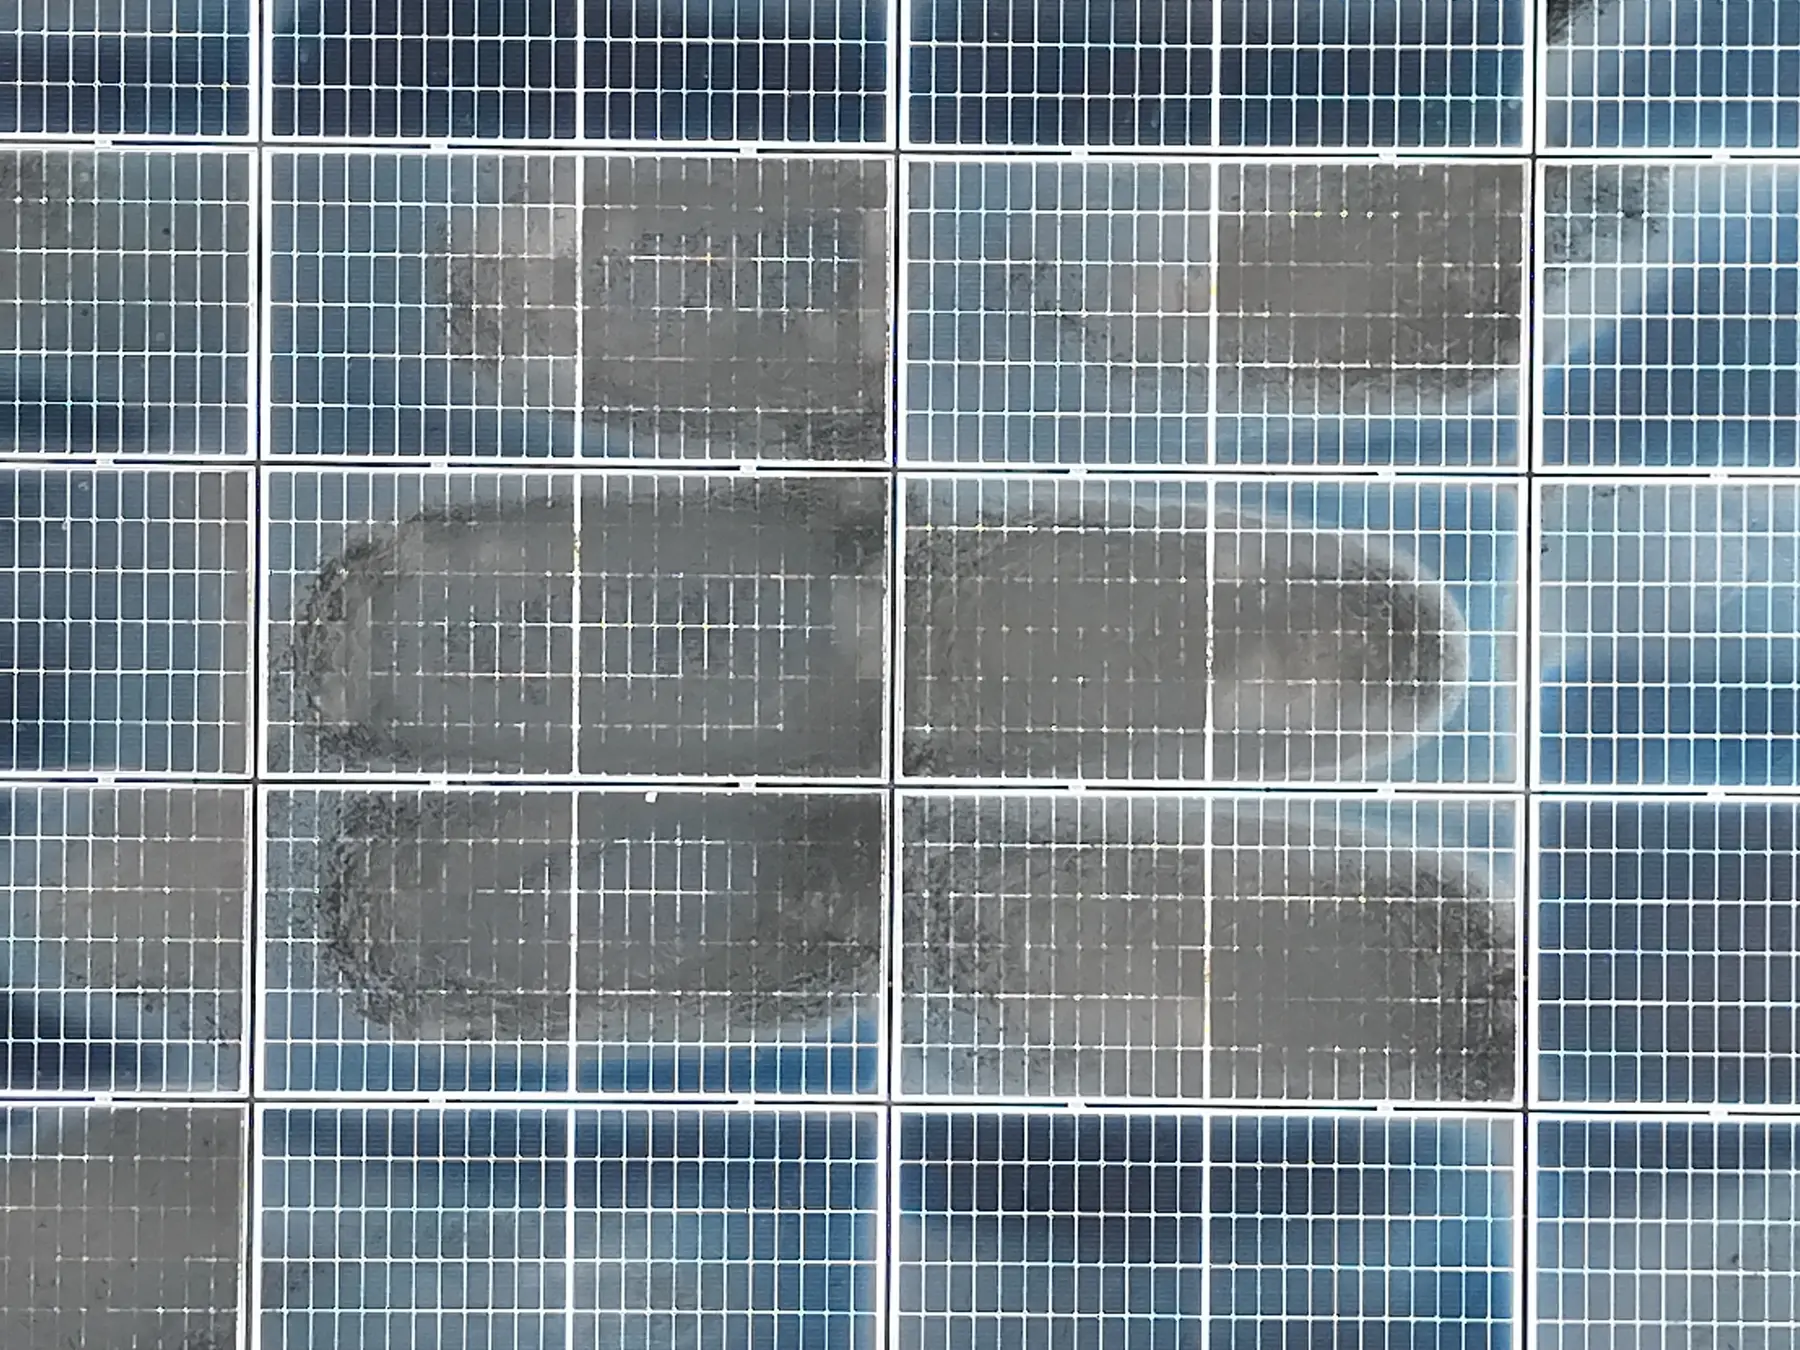
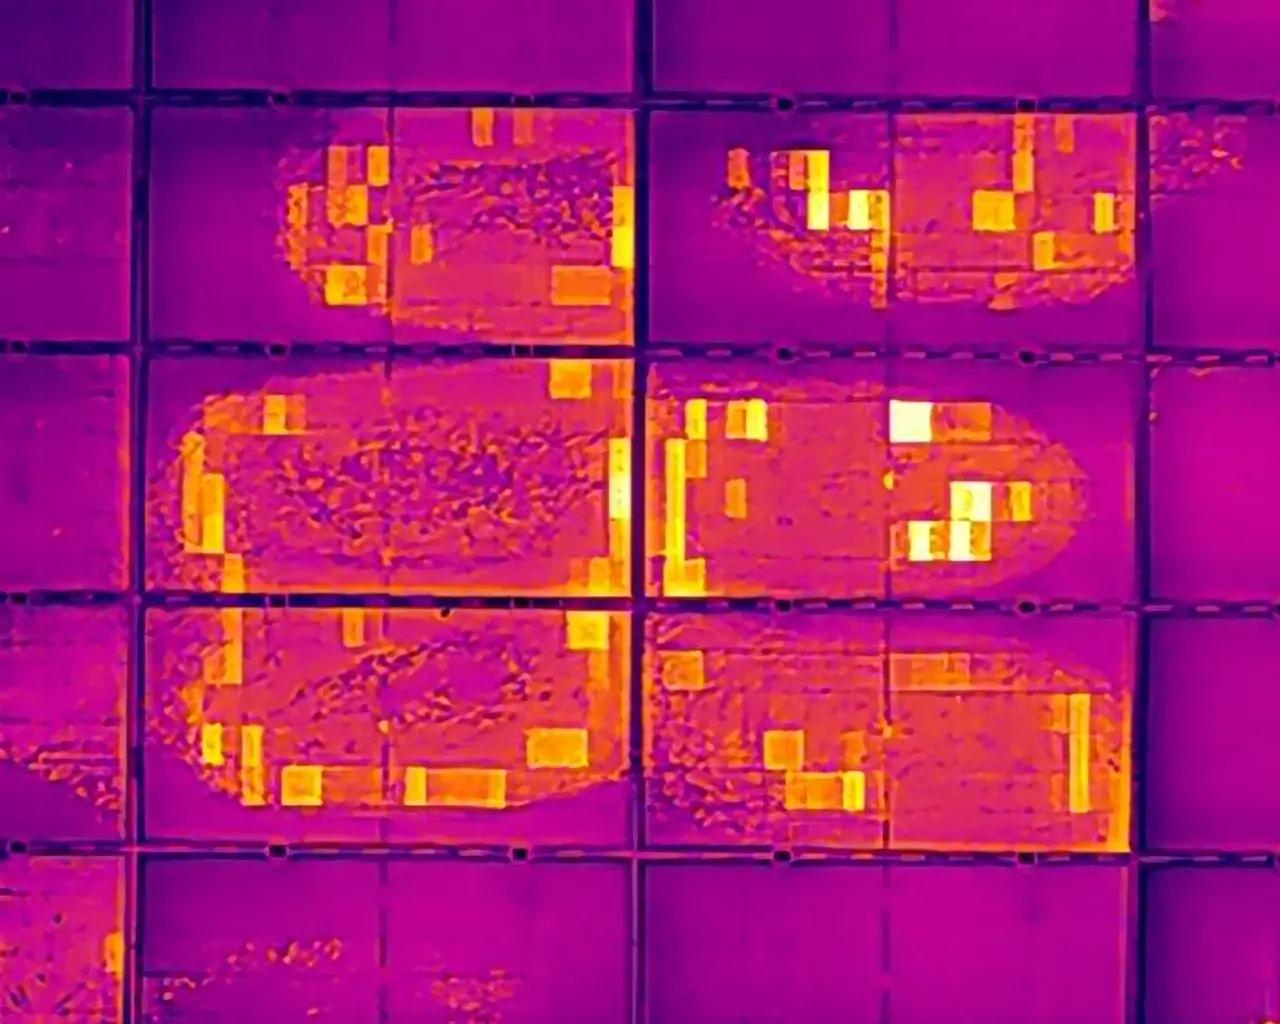
The closer paired view linked visible soiling with concentrated thermal abnormalities, including module areas recorded substantially hotter than comparable neighbouring modules.
Post-cleaning verification
Following cleaning, the remaining surface stains were still visible, but the widespread abnormal heating seen during the initial inspection was no longer visually apparent. The reinspection showed a marked improvement in thermal uniformity.
Inspection outcome
Inspect.
Correct.
Verify.
Inspect beyond the visible surface
RGB imagery documented the condition of the modules while radiometric thermal imagery revealed how unevenly parts of the array were operating.
Direct the corrective response
The magnitude and distribution of abnormal heating, supported by the paired RGB evidence, made the maintenance priority clear and supported prompt cleaning and follow-up.
Verify the result
The follow-up thermal scan confirmed that the widespread heating pattern was no longer visually apparent after cleaning, providing evidence that the corrective action had materially improved array uniformity.
The inspection and reporting approach references IEC TS 62446-3:2017 for PV thermography and ANSI/NETA MTS Table 100.18 for comparative temperature-rise response guidance. IEC CoA identifies the observed PV thermal pattern and component significance, while the NETA comparative ΔT band guides response priority. Findings reflect the recorded inspection conditions, including weather, irradiance, operating state, viewing geometry and surface condition. Follow-up testing and thermal reinspection support confirmation of the corrective outcome.
KAJH Aerial · Barbados