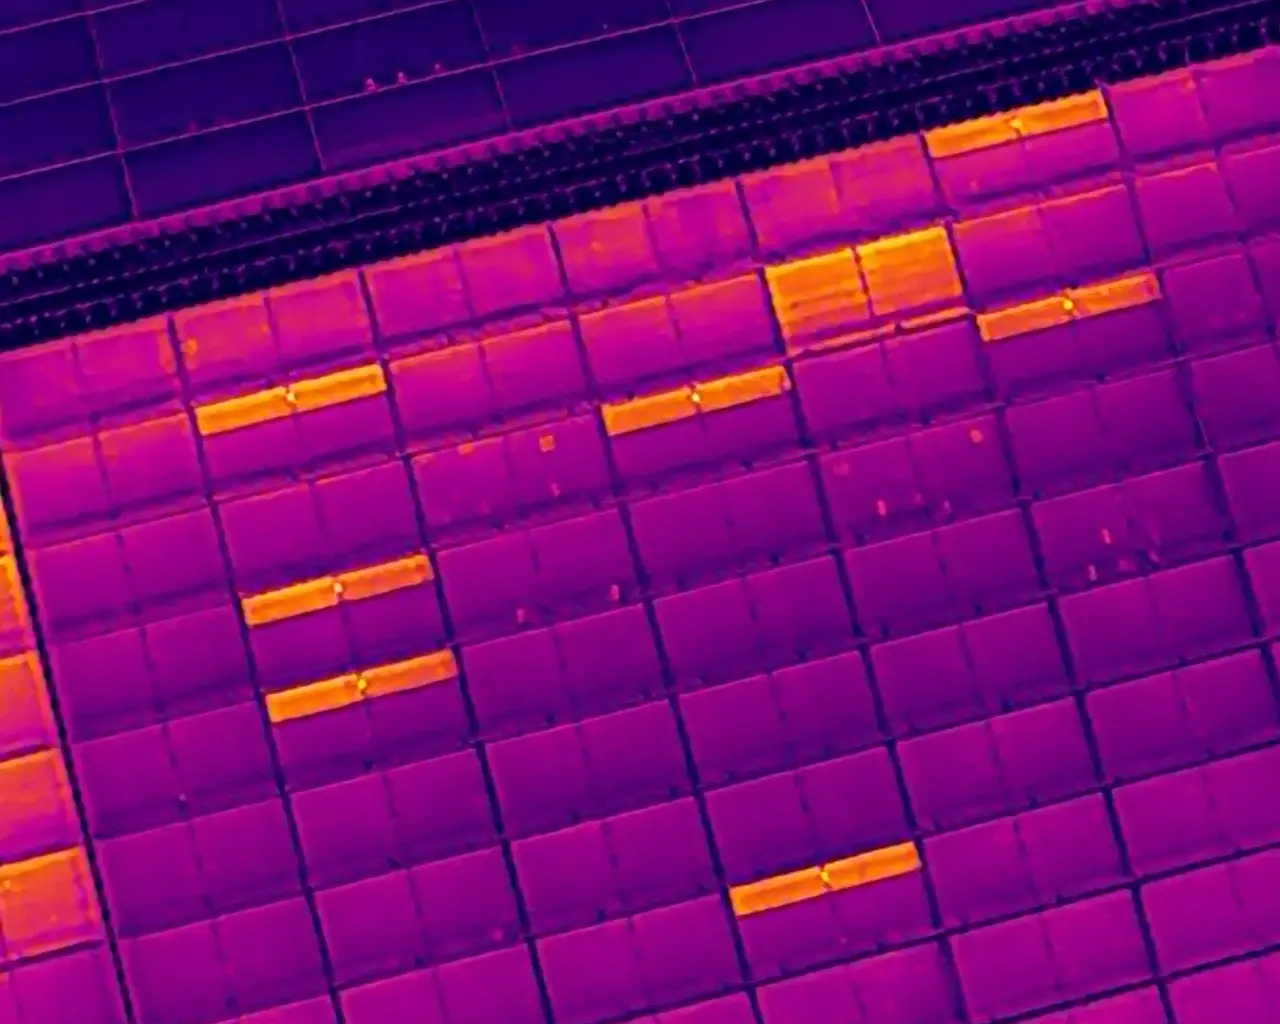
highest affected point in the documented sub-string thermal pattern
 Request an inspection
KAJH Aerial · Solar PV thermal inspection
PV Thermal
Condition Assessment
Inspection overview
From the full array
to the affected cell.
Selected commercial PV inspections documented repeated sub-string thermal anomalies, clear string-level operating defects, paired-module abnormalities and individual modules exhibiting concentrated multi-cell hotspots.
Array-wide RGB and radiometric thermal coverage revealed conditions at several scales. Closer assessment isolated the affected sub-strings, strings, module pairs and cell-level hotspots so electrical testing and corrective work could be directed efficiently. Thermography identifies the pattern; electrical testing confirms the root cause.
- System type
- Commercial rooftop PV systems
- Inspection
- RGB + radiometric thermal
- Finding scales
- Array · string · module · cell
- Response range
- CoA 2 / NETA 02–03
Documented findings
Multiple arrays.
Different anomaly scales.
The measurements below come from selected radiometric inspection records. Each ΔT compares an affected area with a suitable module reference under the recorded inspection conditions.
sub-string differential above the selected comparable reference
highest measured temperature in the multi-cell hotspot finding
maximum documented differential above a comparable module
Technical interpretation
Two standards.
One clear response.
IEC CoA classifies the observed PV thermal pattern by its affected component, extent and technical significance. ANSI/NETA uses comparative temperature rise to guide the urgency of further assessment and corrective action.
Applied together, the two frameworks distinguish the condition being observed from the priority of the response. This gives asset owners a clearer basis for directing electrical testing, maintenance and follow-up verification across a large array.
Commercial impact
The scale and continuity of the affected strings indicate a material loss of solar production across the array. For a commercial PV asset, energy that is not produced cannot offset consumption or contribute its expected financial value—resulting in lost revenue opportunity and weakening the return on the solar investment until the defects are investigated and corrected.
CoA 2 / NETA 02
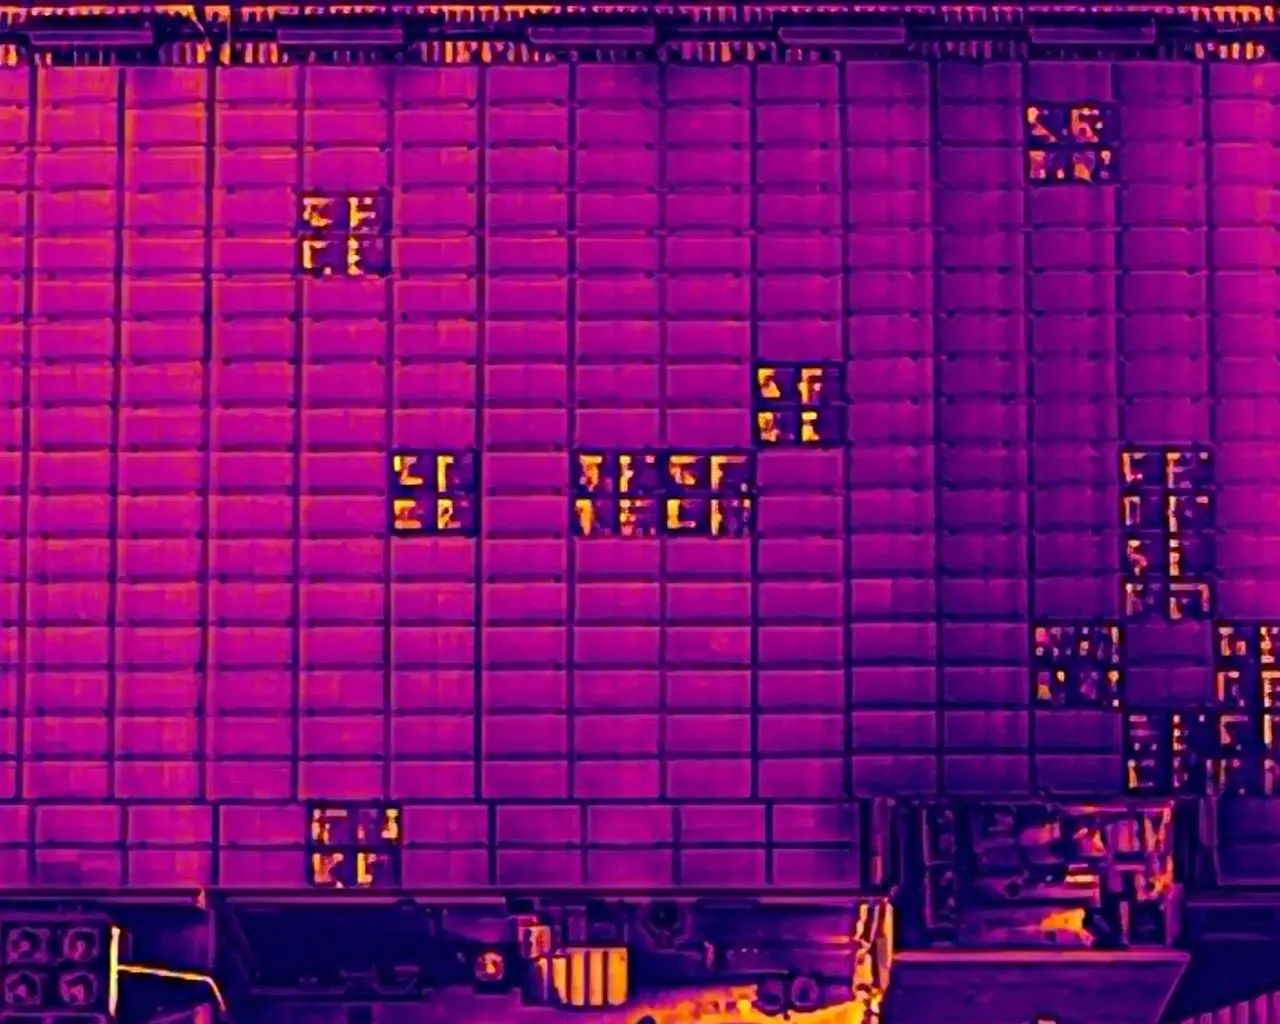
Affected sub-string bands reached 50.2°C against a 42.5°C comparable reference, producing a documented ΔT of 7.7°C. The repeated one-third module pattern is consistent with suspected bypass-diode or associated sub-string electrical faults. Targeted electrical testing is required to confirm the cause.
CoA 2 / NETA 03
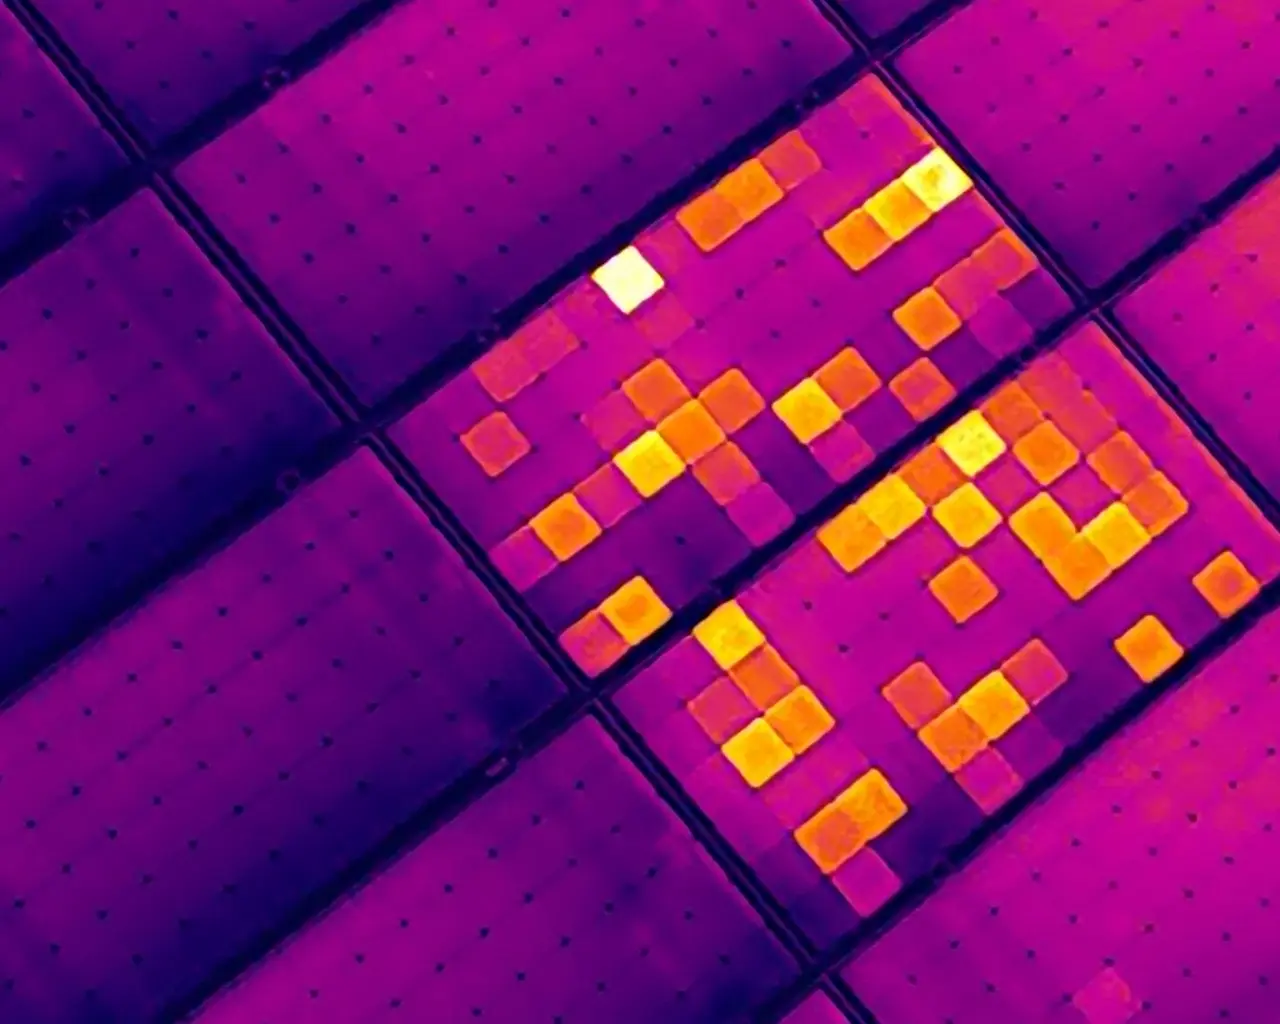
Concentrated cell hotspots reached 88.3°C, with a maximum documented differential of 25.0°C. The extent and intensity of the affected cells represent a severe module-level condition. The observed pattern was classified as CoA 2, while the comparative temperature rise placed the finding in NETA 03—requiring immediate priority for electrical testing, corrective action and replacement assessment.
Image evidence
Wide-area screening.
Targeted diagnosis.
Evidence from selected commercial inspections shows how KAJH Aerial moves from overall system context to string, group, paired-module and individual cell-level abnormalities.
Case study 01
Widespread string-level operating defects
Wide-area screening followed the continuous thermal pattern across a large commercial array and isolated the affected strings and module groups for targeted electrical investigation.
Array-wide string-level screening
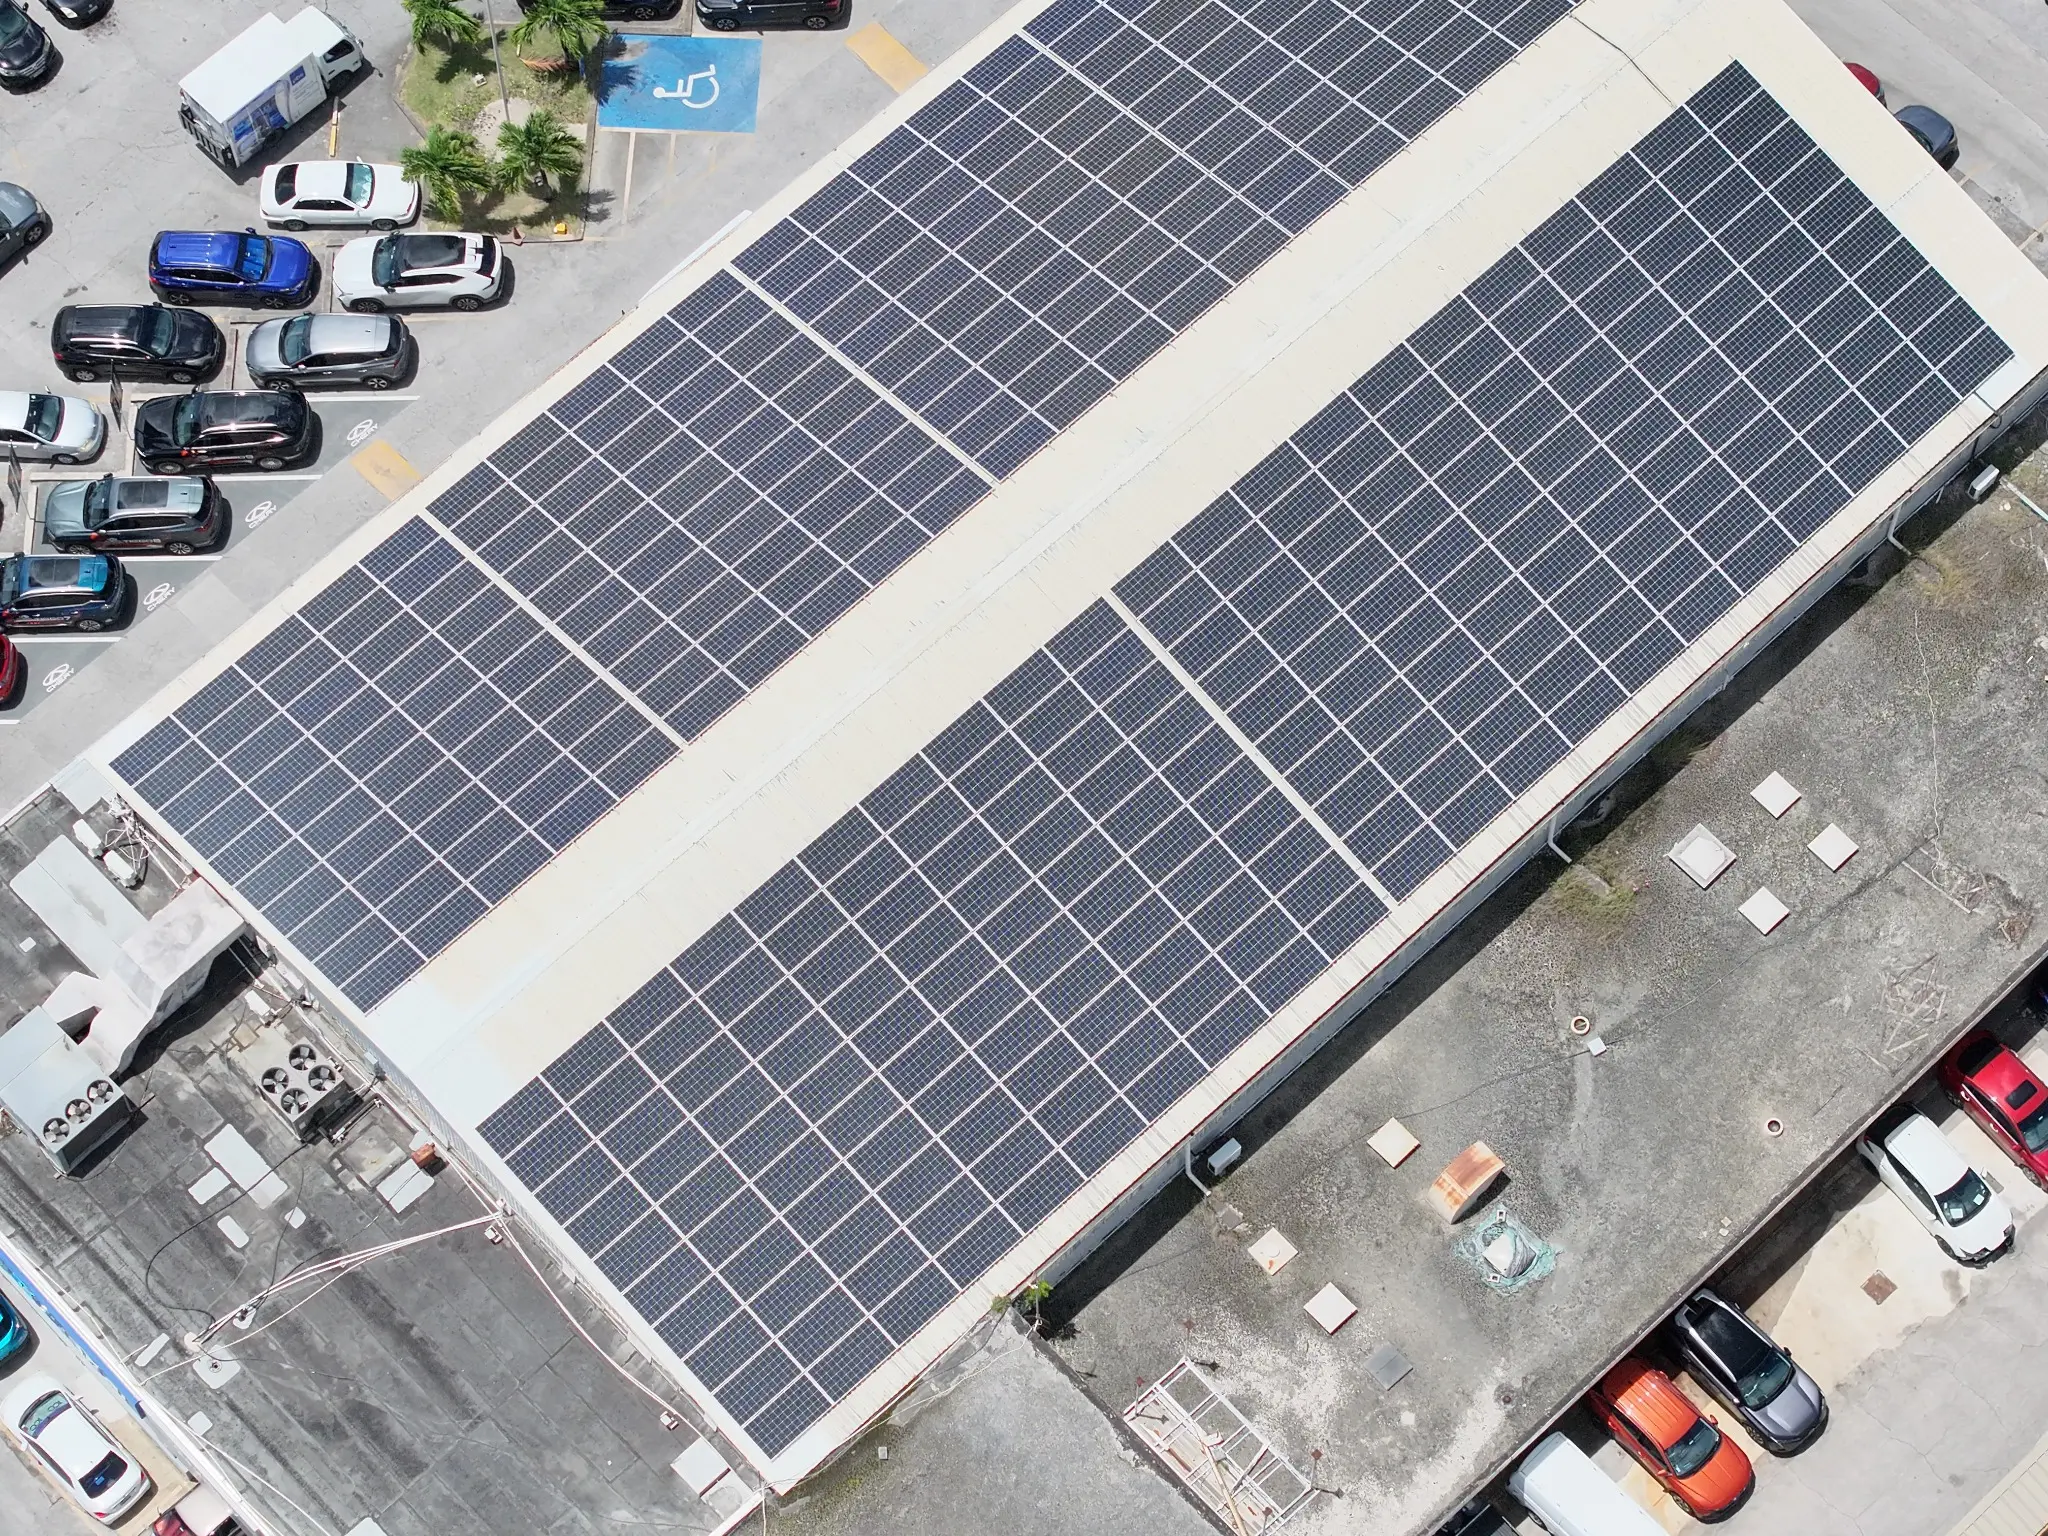
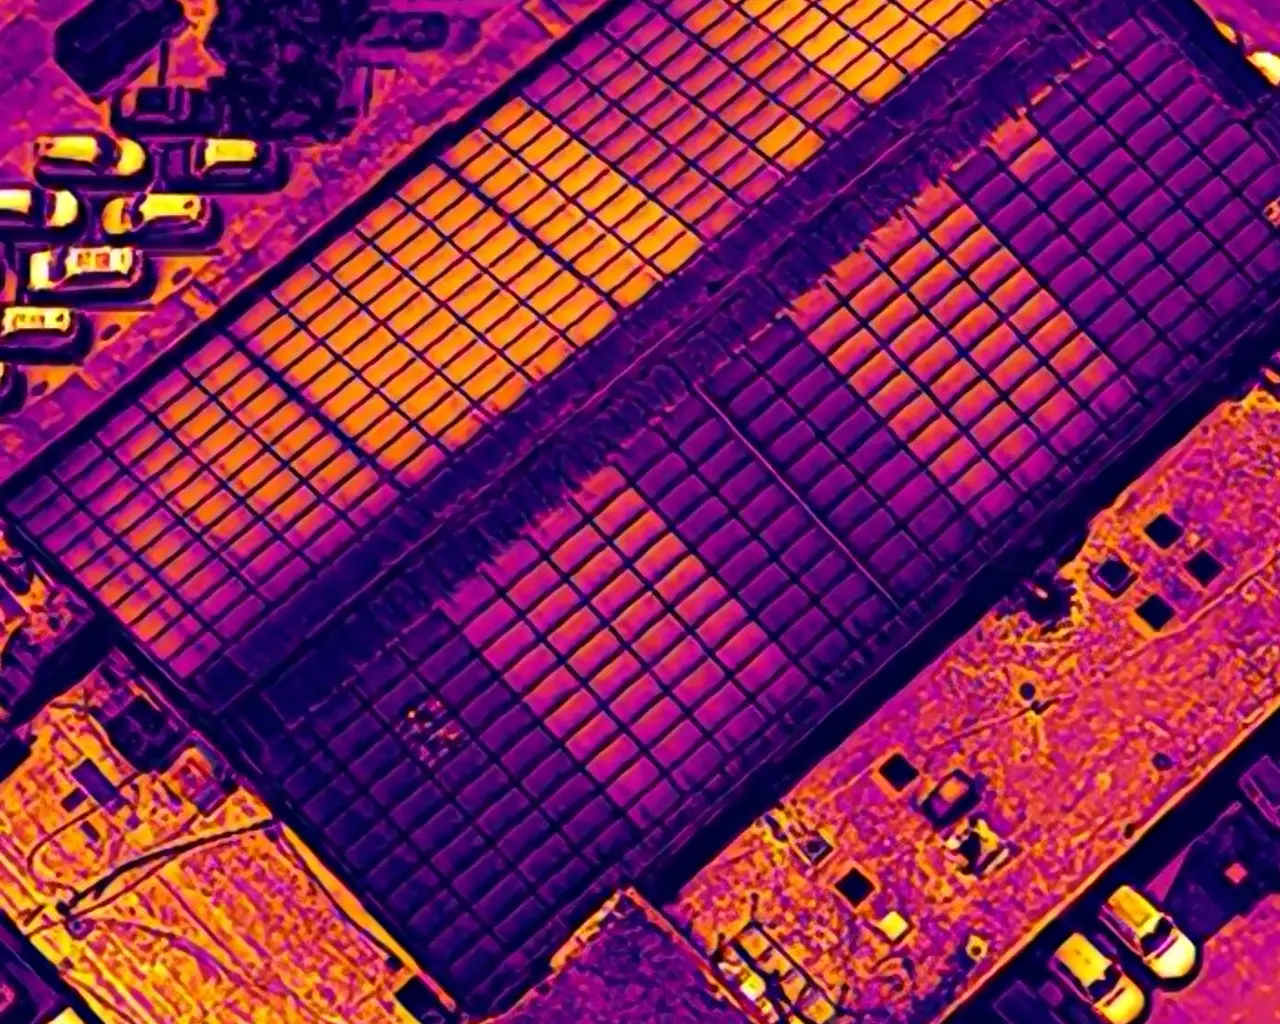
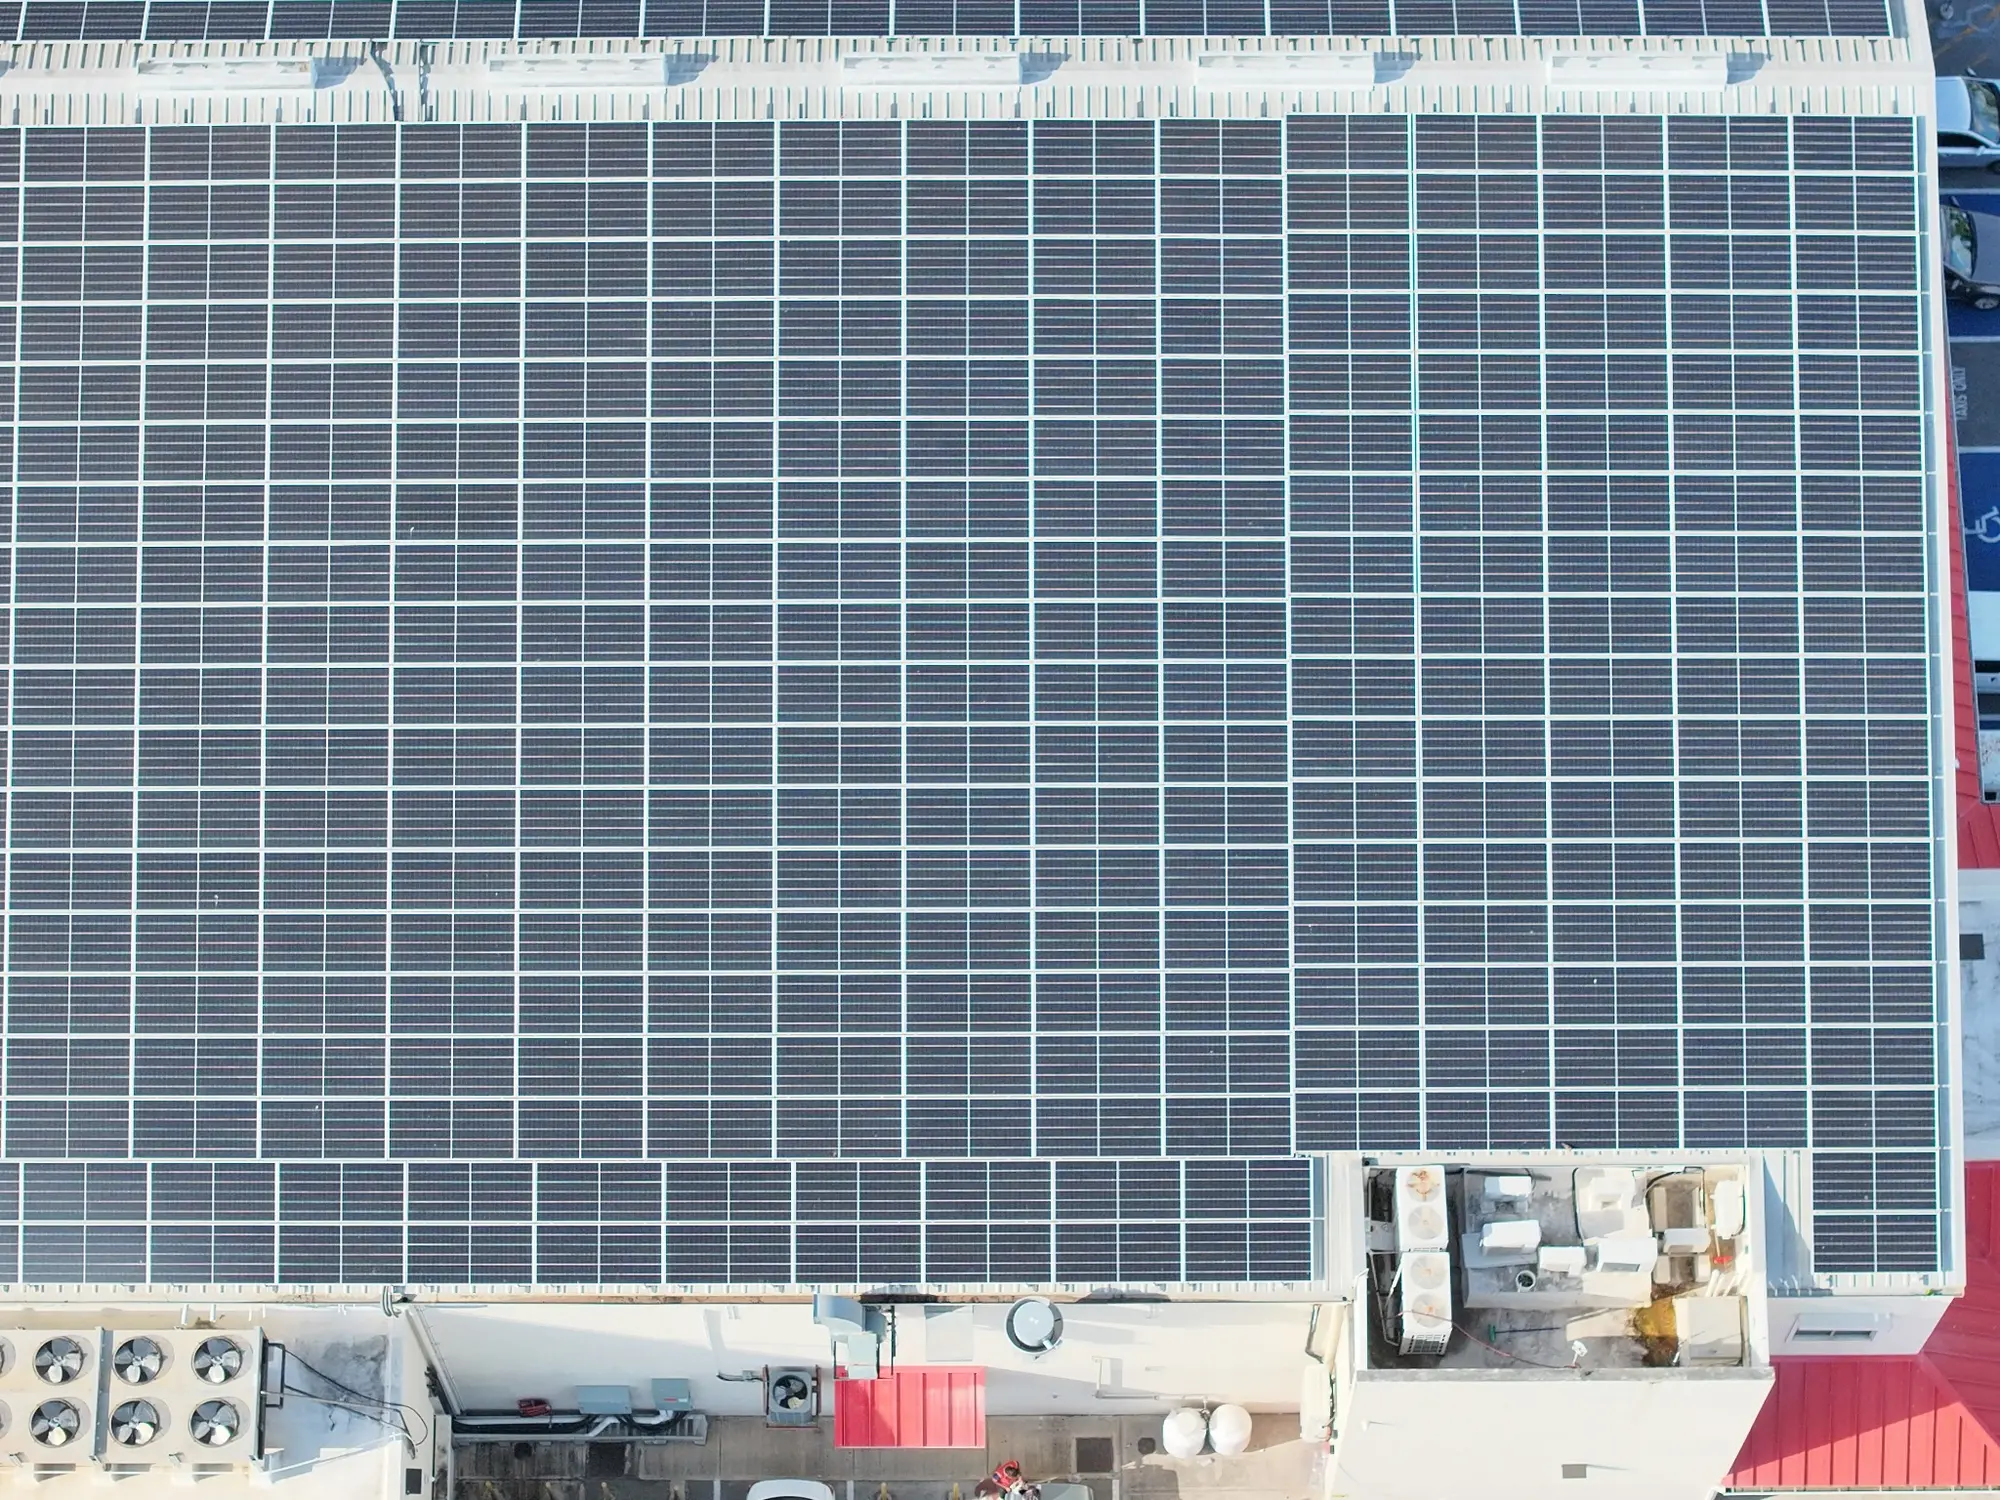
The wider RGB view establishes the complete roof layout and scale of the commercial system. In the paired thermal image, long continuous bands of modules display distinctly different operating temperatures from neighbouring strings—revealing clear string-level defects across a substantial portion of the array.
Repeated sub-string thermal anomalies
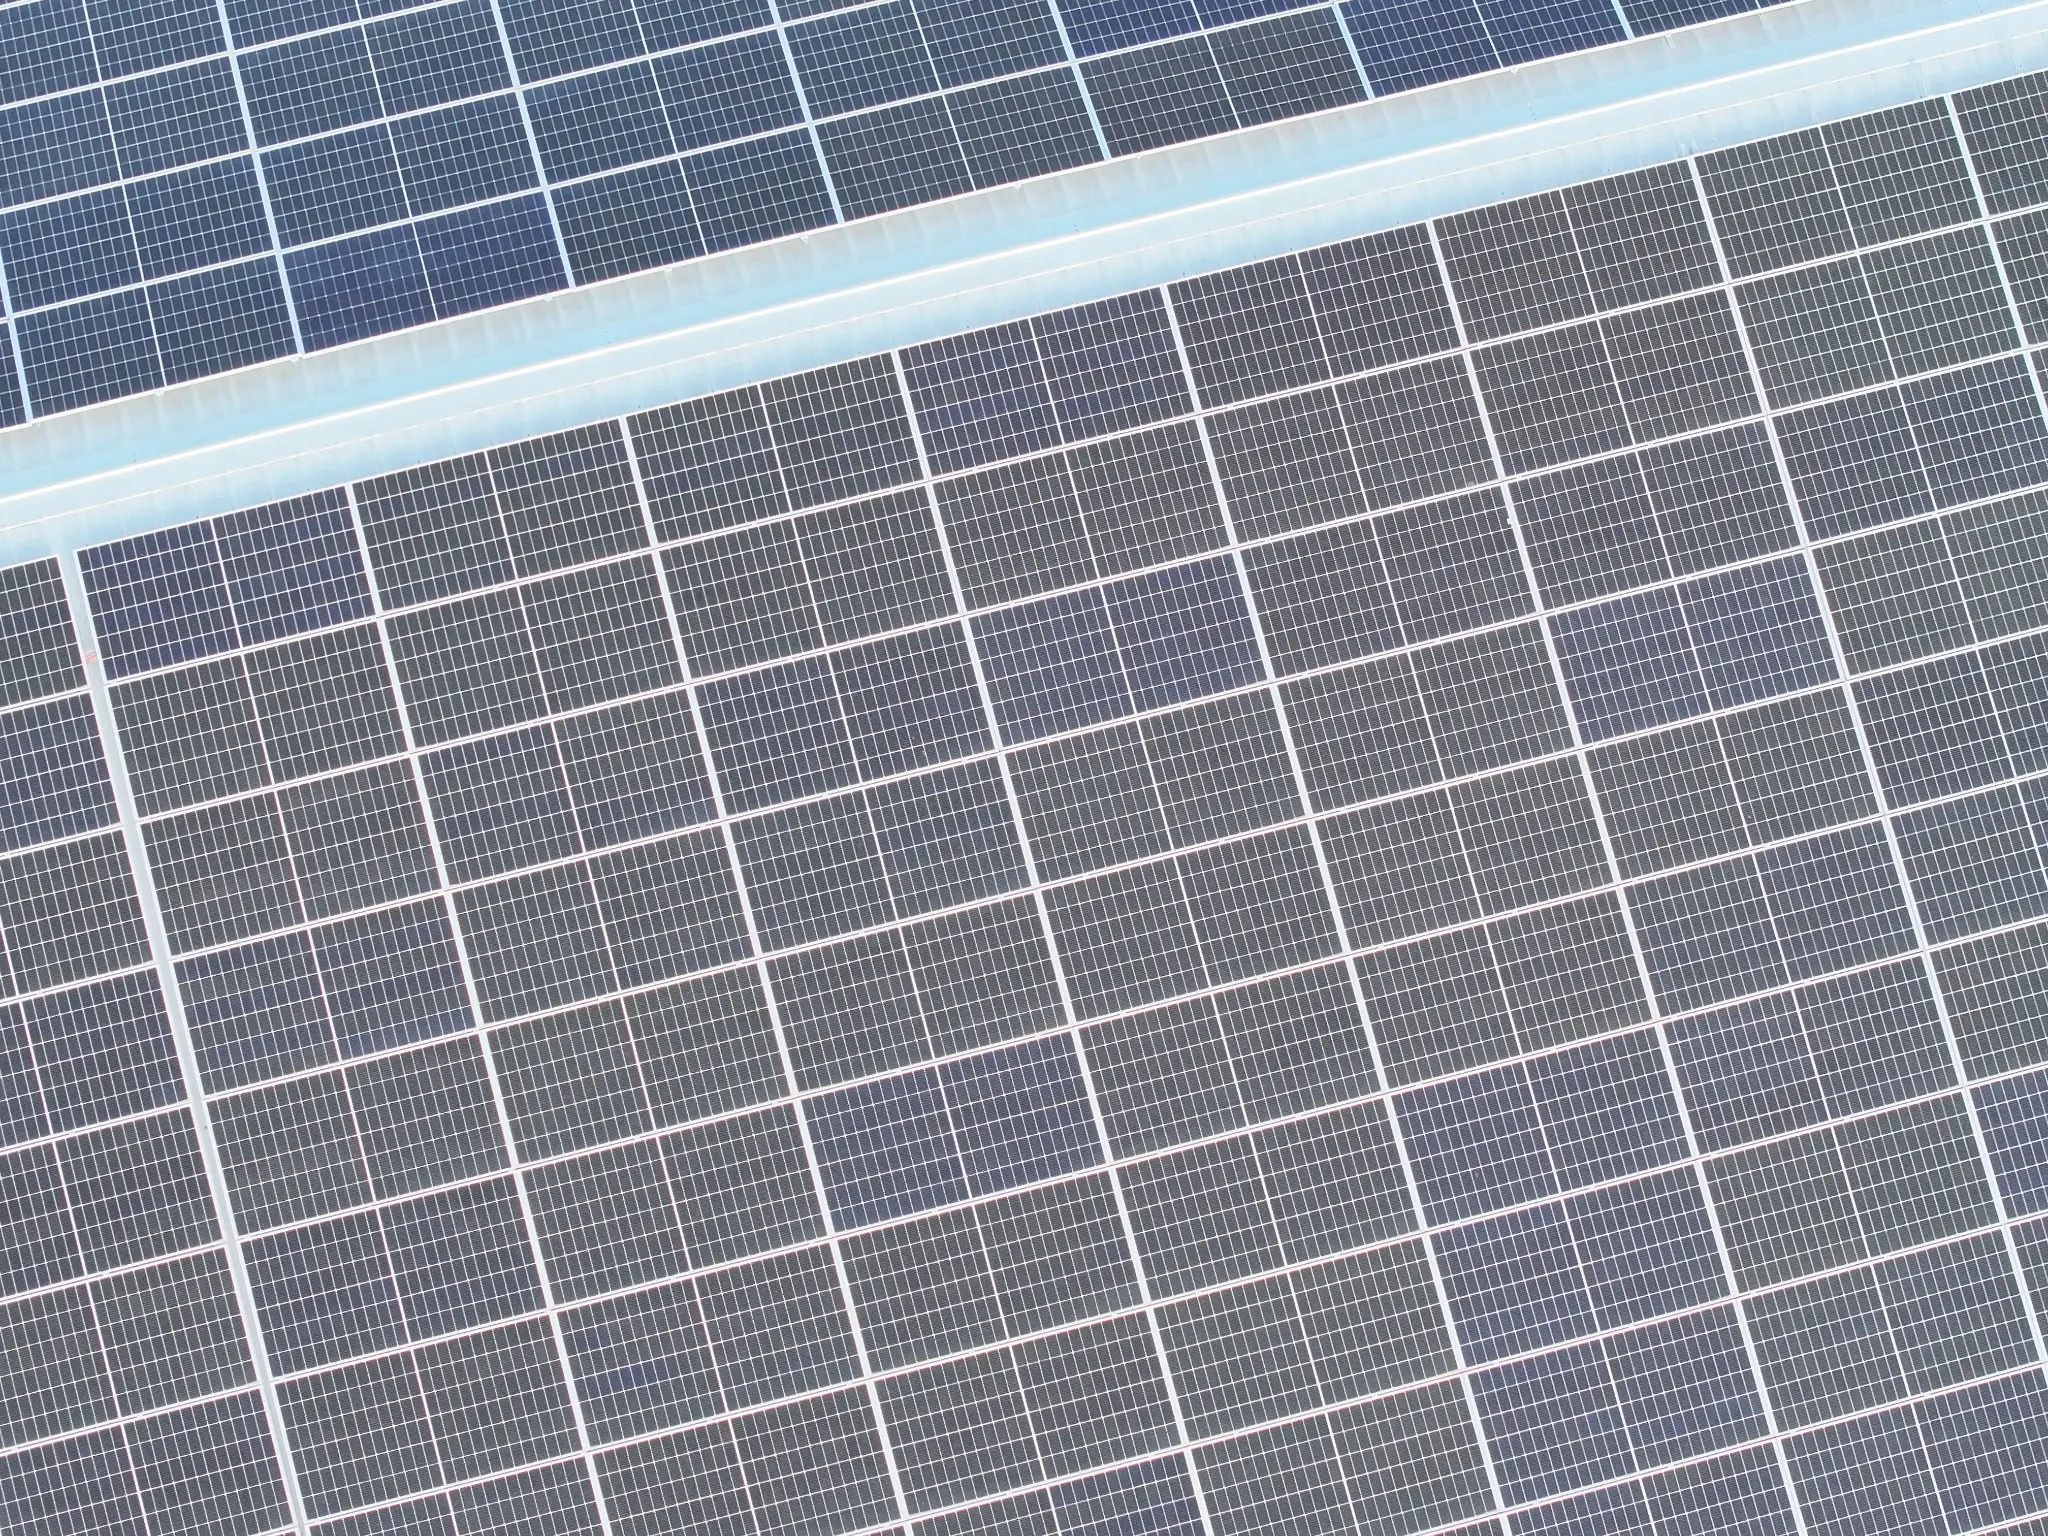
The RGB image shows no obvious visible condition explaining the difference. The matched thermal view reveals repeated one-third module bands across multiple modules. Radiometric evidence recorded affected points up to 50.2°C against a 42.5°C comparable reference—a ΔT of 7.7°C. The pattern is consistent with suspected bypass-diode or associated sub-string electrical faults; electrical testing is required for confirmation.
Case study 02
Repeated paired-module abnormalities
On a separate commercial system, repeated two-module groupings led the assessment from array-wide pattern recognition to detailed module and cell-level evidence.
Repeated paired-module pattern
Across this system, thermal abnormalities recur in clearly defined two-module groupings while the matching RGB images show no obvious surface condition that explains their repetition. The repeated paired pattern is consistent with a likely shared optimizer or module-pair electrical issue rather than unrelated module defects. Targeted electrical testing is required to confirm whether the affected component is the optimizer, its connections or another electrical element common to each pair. Because several pairs are affected across the array, the combined underperformance could materially reduce system yield and the financial return expected from the PV investment.
Module and cell-level hotspots
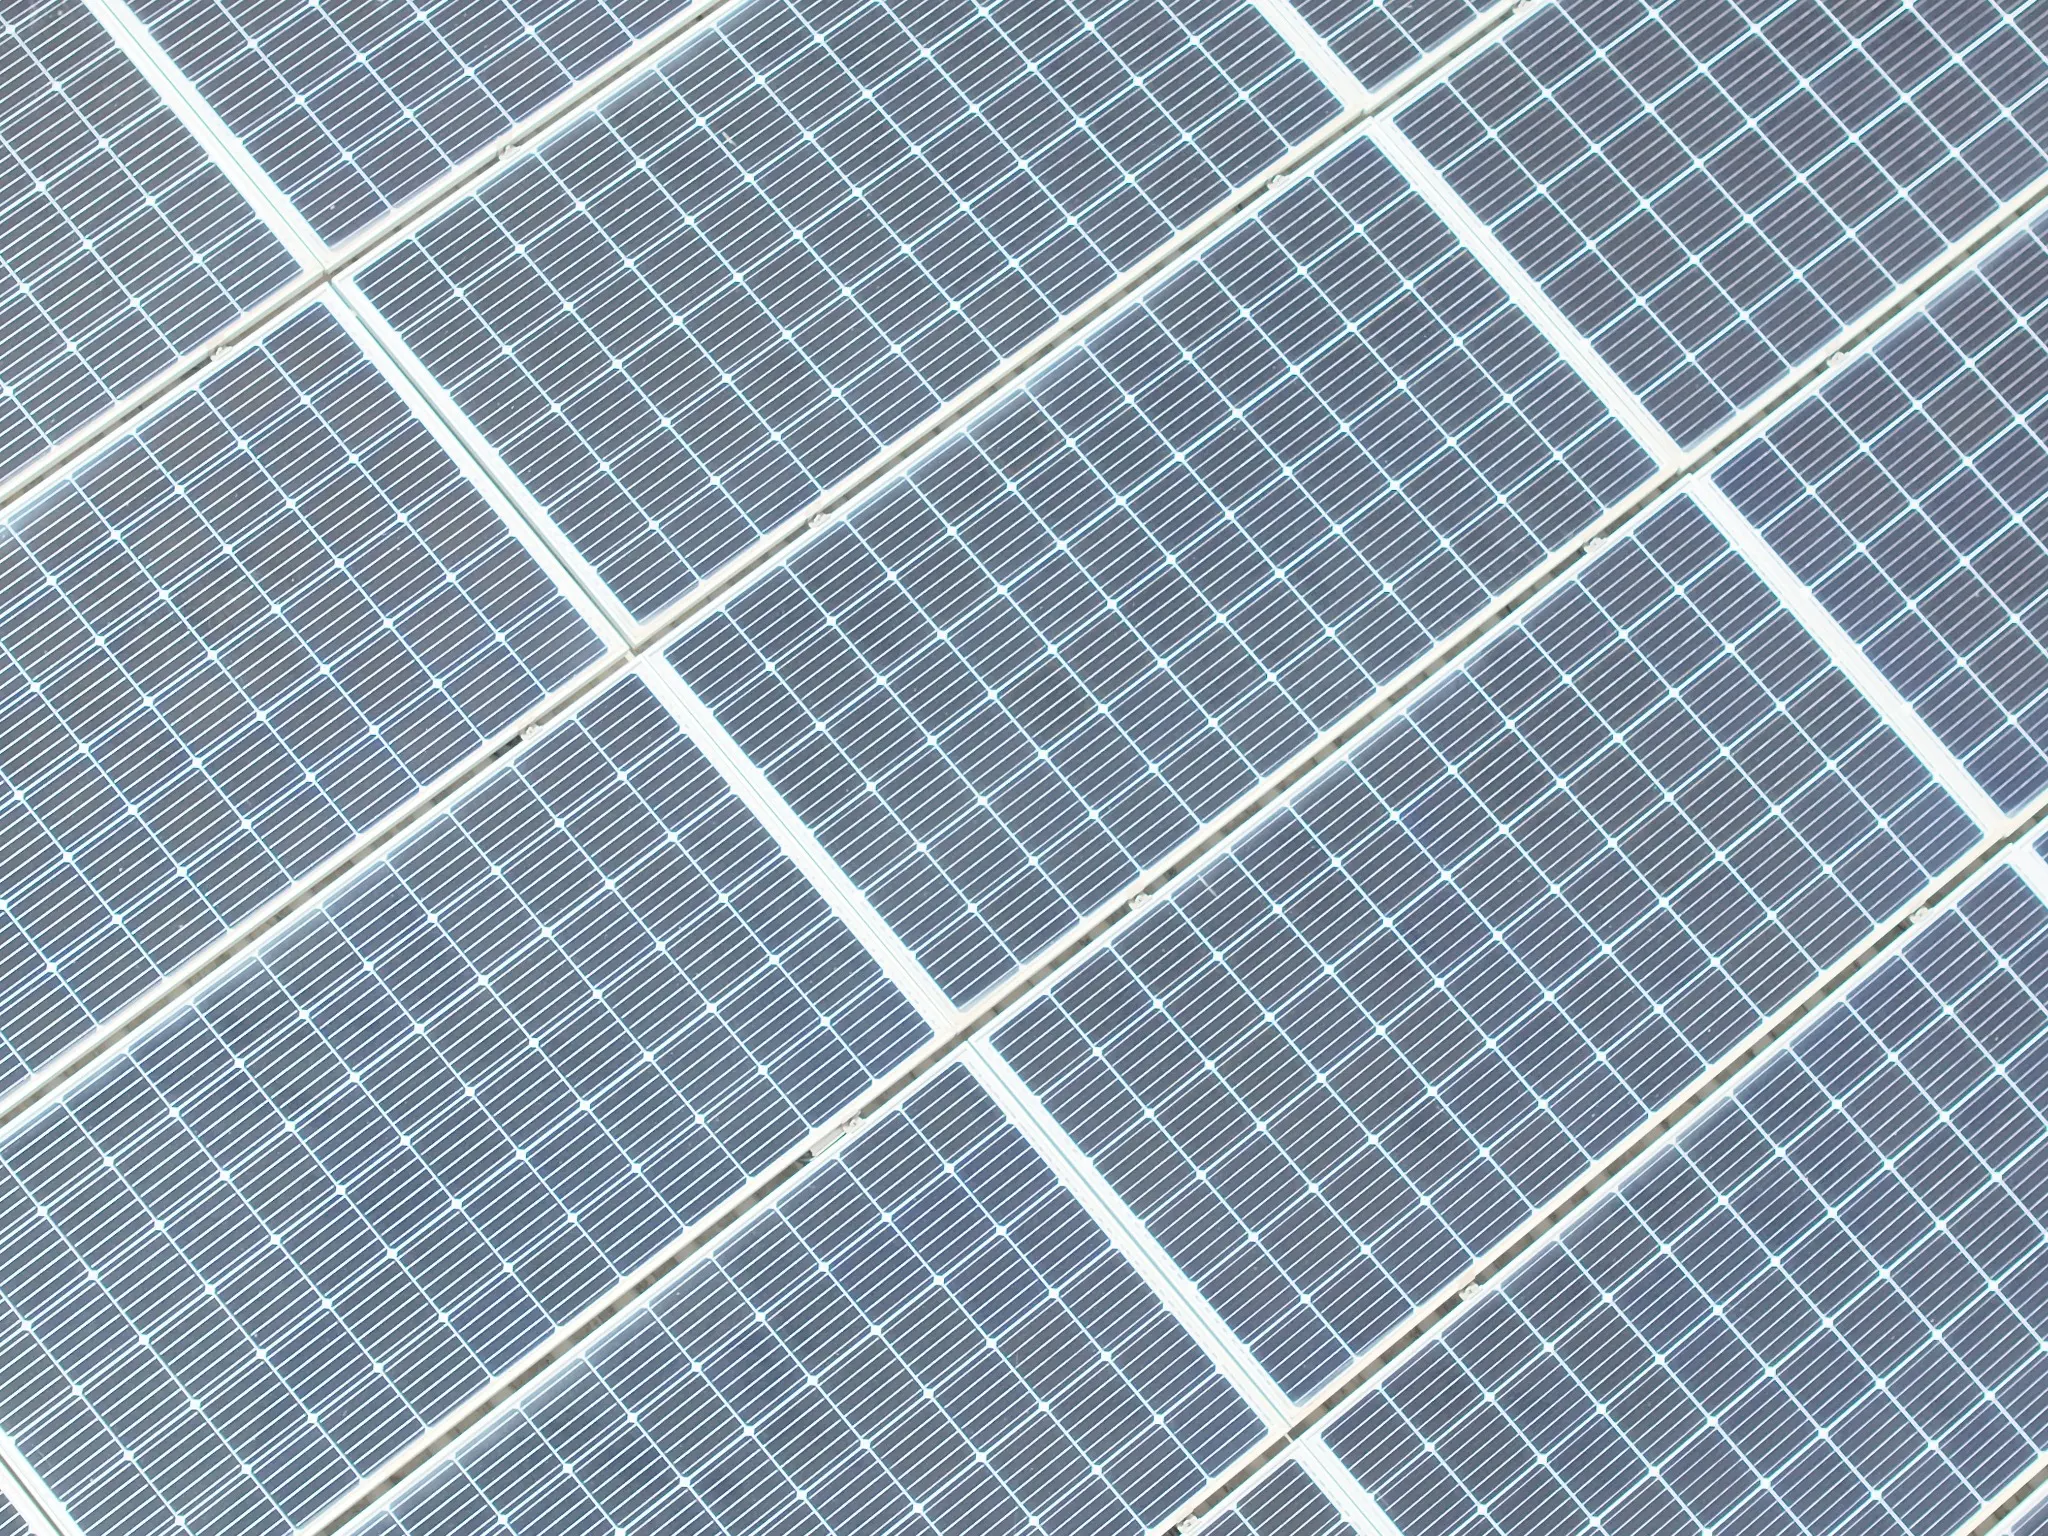
Closer matched RGB and thermal views of one affected pair isolate the same two modules for direct comparison. While the visible image shows no obvious surface damage, the thermal image reveals widespread multi-cell hotspot patterns across both modules. Radiometric analysis recorded a peak of 88.3°C against a 63.3°C comparable-module reference—a ΔT of 25.0°C. This severe module-level condition is classified as IEC CoA 2 / NETA 03, requiring immediate-priority electrical testing, corrective action and replacement assessment.
Inspection outcome
Screen.
Prioritise.
Investigate.
Locate abnormalities across the array
Consistent wide-area RGB and thermal coverage identifies the strings and roof zones requiring closer radiometric review.
Separate string and module-level findings
Pattern continuity distinguishes broad string-level operating defects from individual module and cell hotspots, allowing the highest-impact areas to be prioritised first.
Protect system yield and investment value
Targeted electrical testing and corrective action restore attention to the affected strings, reduce avoidable production loss and protect the expected performance of the PV investment.
The inspection and reporting approach references IEC TS 62446-3:2017 for PV thermography and ANSI/NETA MTS Table 100.18 for comparative temperature-rise response guidance. IEC CoA identifies the observed PV thermal pattern and component significance, while the NETA comparative ΔT band guides response priority. Findings reflect the recorded inspection conditions, including irradiance, wind, operating state, viewing geometry and surface condition. Targeted electrical testing completes the diagnostic process and confirms the appropriate corrective action.
KAJH Aerial · Barbados